
Credit Spreads
What are Credit Spreads?
Let’s explain it as simple as possible.
Credit, references the yield of a fixed income instrument. In this case, we will consider corporate bonds and government bonds, both with the same maturity i.e. 1 year, 2 years, 10 years, etc.
Spread, references the difference between one thing and another. In this particular case we will consider the difference in yields of corporate bonds and government bonds of the same maturity.
What do you think if we explain what the yield means?
The yield explains different aspects of a company or country. For example, if we consider two similar companies where one company needs to issue a bond to raise money, one company will pay to the holder of the bond a certain coupon. Let’s say company A pays a coupon of 4.0% while company B pays a coupon of 5.0%. Why is that? Imagine that company A has fewer financial troubles than company B. Will you be willing to accept the same coupon for both companies if one has more risk of not paying you back the money that you lent it? Probably not, and probably you will demand a higher coupon from the riskier company. With yield it is something similar, where the yield fluctuates as per market demand for that or those bonds of the company. Thus, as a company becomes less risky through time, then the market would consider it less risky and would be willing to demand less yield. If the company becomes riskier then the same applies the other way around.
As we have explained the corporate bonds, the concept is quite similar for a country, where a country considered low risk of non-payment of the bond to the lender should have a lower yield than one that has a higher risk.
How are we doing until now? Easy, isn’t it?
Perfect, so let’s ask ourselves the following question: What is safer? A country or a company? Who has less or more risk to pay back to the lender of money, a company or a government? Most probably, intuitively, the answer is “of course, a company has more risk of not paying the lender than a country”. Yes, in most of the cases that is completely true.
“Hey, so that sounds like the yield of a corporate bond should be higher than the yield of a government bond.” Bingo! That is correct. Thus, the difference (“spread”) between corporate bonds and government bonds should increase once companies become riskier and it should decrease when companies are less risky to not paying the lender.
Next question: How has the behaviour of the spread been through time? Ah, very good question. Let’s see it:
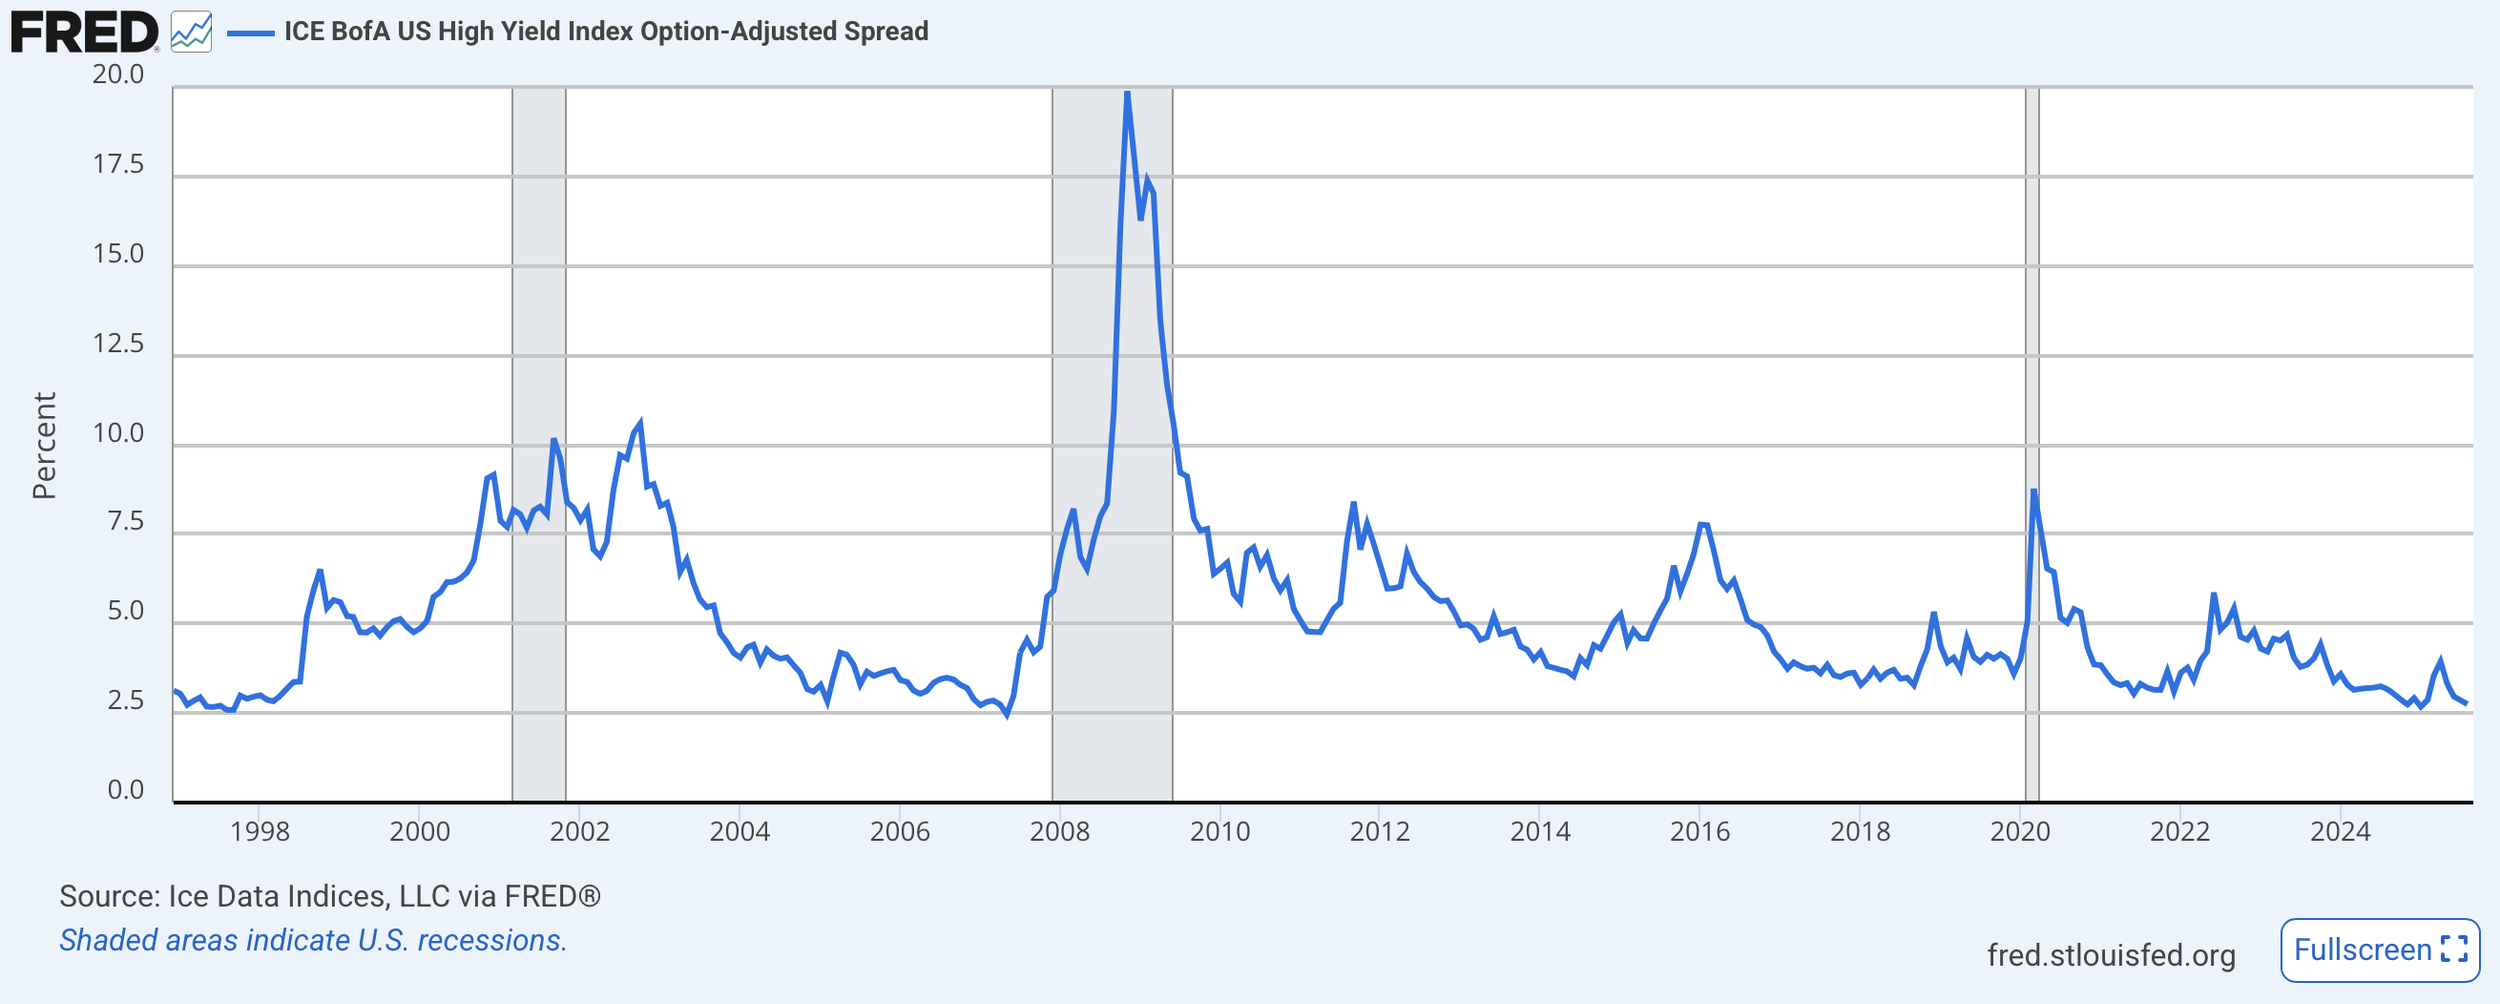
Source: Federal Reserve Bank of St. Louis
The ICE BofA Option-Adjusted Spreads (OASs) are the calculated spreads between a computed OAS index of all bonds in a given rating category and a spot Treasury curve. An OAS index is constructed using each constituent bond's OAS, weighted by market capitalization. The ICE BofA High Yield Master II OAS uses an index of bonds that are below investment grade (those rated BB or below). (FRED)
From the chart we can make a few observations.
When the U.S. economy was moving towards periods of stress i.e. recessions, the spread widened. For example, during the recession of 2001 - 2002 the spread reached levels of 10.0%, while during the global financial crisis (2008 - 2009) the spread reached levels of 20.0%, and during the pandemic it reached levels of 9.0%.
Also, we can notice that after recessions the spread shows a downtrend, which explains how markets are considering a more stable economic situation. Now, there are several spikes without recession i.e. 2011 - 2012, 2016, 2022 - 2023.
Another observation that we can make is that at the moment the spread is reaching low levels such as during 2007, before the global financial crisis.
Practically, what does this mean?
At the moment, markets are showing a high degree of optimism, or even complacency, as corporate credit risk is being priced at very cheap levels. This can be seen in the fact that companies are able to issue debt with very low premiums over government bonds, something that reflects strong confidence in corporate balance sheets, low perceived default risk, and ample global liquidity.
Historically, when spreads reached extremely tight levels, it often signaled vulnerability in the system. For example, in 2007 spreads were very low just before the global financial crisis unfolded. This tells us that when investors stop pricing in enough risk, fragilities tend to build up beneath the surface, leaving markets more exposed to shocks.